

 Photo: Kari Shea / Unsplash
A tour of your dashboard home
What the numbers, cards and buttons on the dashboard home page mean and how to use them every day.
🖥️ Open in dashboard/dashboard🎬 Watch the video
Videos are in Arabic.
The home page is the first thing you see when you sign in to dashboard.vondera.app. It gives you a quick picture of how your store is doing: visits, sales, orders and which channels bring in customers. Use it as your daily check-in before you open your orders.
Where to find it
Click Home at the top of the sidebar at any time, or open /dashboard.
The key numbers (KPIs)
Under the top bar you will see four tabs. Click a tab to show its chart for the selected period.
Change the period and channel
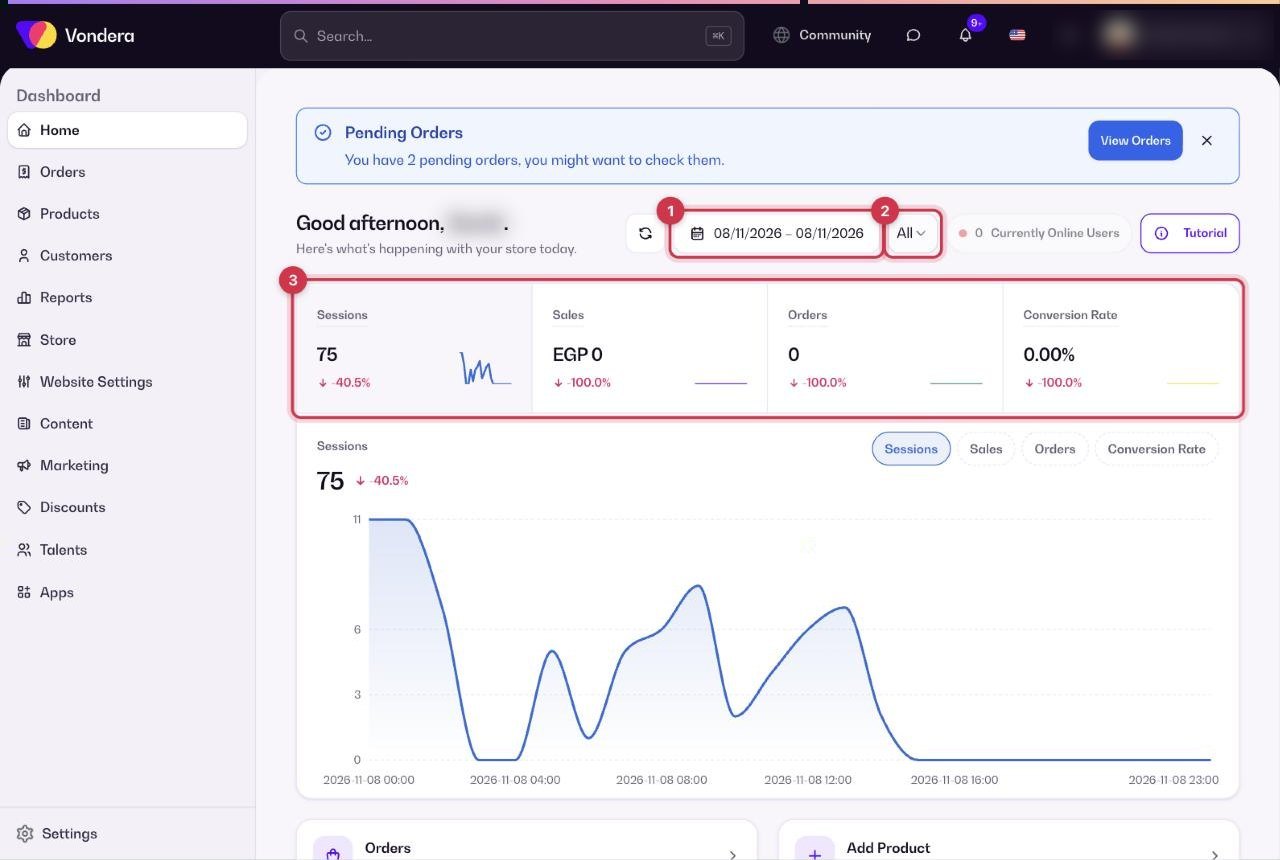
- Click the date range picker at the top of the page and choose a period (for example today, last 7 days or a custom range).
- Use the channel filter (set to All by default) to see numbers for one sales channel only.
- The KPI tabs and charts update automatically.
Other things on the home page
- Currently Online Users shows how many shoppers are on your store right now. Click it to open Live view and see their locations and activity in real time.
- Visit store opens your online store in a new tab so you can check it like a customer.
- Tutorial plays a short guide to the page.
- Shortcuts take you straight to Orders or Add Product.
- The Subscription card shows your plan, with links to Manage subscription and Billing & History.
- Channel Performance cards (Facebook, TikTok, WhatsApp, Instagram, Direct) show how each channel is doing. Click a card to open its full report.
- Latest Blogs shows recent articles and tips from Vondera.
Common questions
Why are my numbers different from my ads manager?
Ad platforms count clicks and their own conversions. Vondera counts real store sessions and orders, so small differences are normal.
What does "Direct" mean in Channel Performance?
Visits and orders that did not come from a tracked social channel, for example shoppers who typed your store link.
Can I see more detailed reports?
Yes. Open Reports in the sidebar for sales, products, channels, team and courier reports.