

 Photo: Luke Chesser / Unsplash
Couriers report
Compare shipping volume, cost and delivery success for each courier you use.
🖥️ Open in dashboard/dashboard/statistics/couriersThe Couriers report (Couriers Analytics) shows how each shipping company is doing for you: how many orders it carried, what it cost, and how many were delivered, failed or put on hold. It is the quickest way to see which courier delivers best and which one is costing you returns.
Where to find it
Go to Reports › Couriers. There is one button for each courier you have added in Orders › Couriers.
Read the report
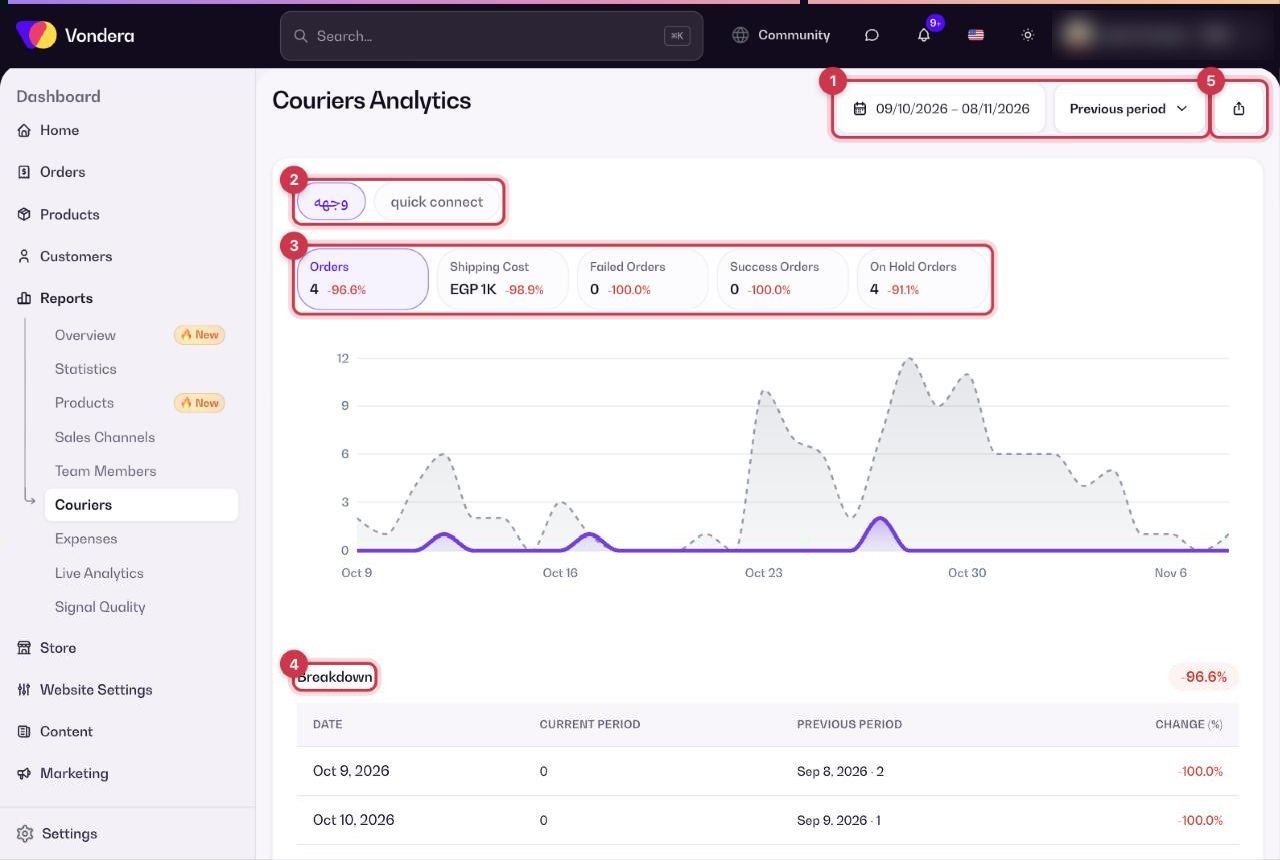
- Open Reports › Couriers and choose a date range.
- Click a courier’s button to see its numbers.
- Check the metric cards; the % shows the change from the Previous period.
- Look at the chart and the Breakdown table for day-by-day figures.
- Click Export CSV to download the data.
Orders
Orders handed to this courier in the period.
Shipping cost
Total shipping charged for those orders.
Success orders
Orders delivered to the customer.
Failed orders
Orders that could not be delivered (for example the customer refused or could not be reached).
On-hold orders
Orders waiting, not yet delivered or failed.
Breakdown
Date, current period, previous period and % change.
💡 TipWork out each courier’s delivery rate: success orders ÷ orders. If one courier fails much more often in some areas, try another courier there.
Common questions
Why is a courier missing from the buttons?
Only couriers you have added appear. Add it in Orders › Couriers.
Do the numbers include orders still on the way?
Orders that are not delivered or failed yet are counted under On-hold orders.