

 Photo: Luke Chesser / Unsplash
Reports overview: your key numbers explained
What every metric and chart on the Reports overview means, and how to pick dates and compare periods.
🖥️ Open in dashboard/dashboard/statistics/overview🎬 Watch the video
Videos are in Arabic.
The Reports overview is the health check of your store. In one page you see how much you sold, how many people visited, how many of them bought, where they came from and how much you earned after costs. Pick a date range, and compare it to an earlier period to see whether things are getting better.
Where to find it
Click Reports in the sidebar. The overview opens first; the other reports (Products, Sales channels, Employees, Couriers, Conversion quality) are in the Reports sub-menu.
Choose dates and compare
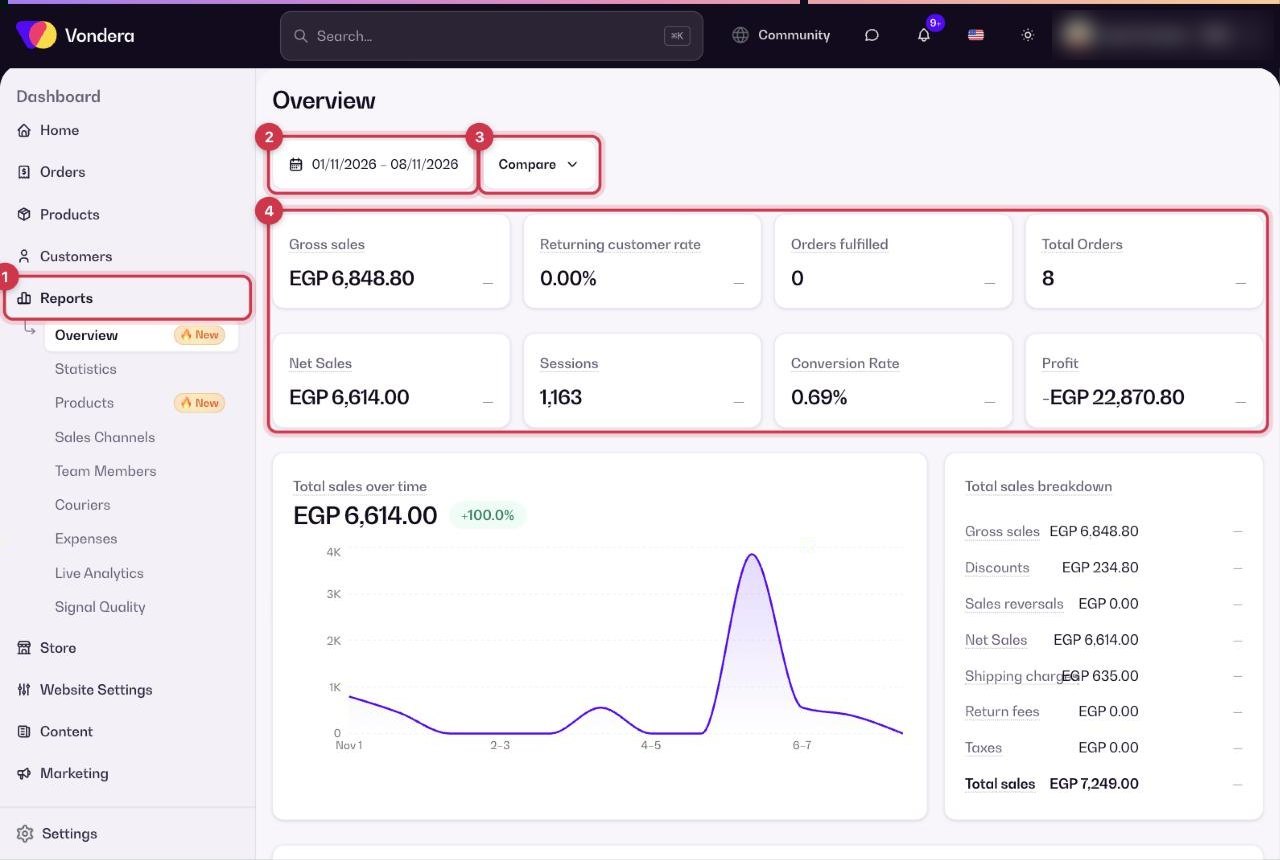
- Open Reports.
- Click the date range and choose the period you want, for example the last 30 days.
- Turn on Compare to compare with the previous period. Each number then shows how much it went up or down.
- Read the metric cards first, then scroll down for the charts.
The main numbers
The charts
- Total sales over time — your sales day by day, so you can spot good and slow days.
- Sales breakdown — how your sales are made up: discounts, reversals (returned or cancelled amounts), shipping, return fees and taxes.
- Units sold by product — which products sold the most pieces.
- Sales by channel — sales from each source, such as Facebook, Instagram, TikTok, WhatsApp or Direct.
- Average order value (AOV) — the average amount per order: sales ÷ orders.
- Conversion breakdown — how visitors move toward buying, step by step, so you see where they drop off.
- Sessions over time / by device / by social referrer / by location / by landing page type — when visitors come, on mobile or desktop, from which social app, from which area, and which kind of page they land on first.
- Orders over time — number of orders day by day.
Common questions
Why is net sales lower than gross sales?
Net sales removes discounts and returned or reversed orders from gross sales. The Sales breakdown chart shows how much each one took off.
What is a good conversion rate?
It depends on your products and traffic. Compare against your own previous periods with Compare and work on improving it over time.
Why do numbers here differ from the Sales channels report?
The Sales channels report counts only orders that can be linked to a traffic source, so its totals can be lower.